What's a good ecommerce conversion rate? Benchmarks (and why averages mislead)
The latest public benchmarks by industry and device, what "good" looks like on Shopify, and the numbers that matter more than any average.

By Nicolas Fradet, founder of FunnelSpark · 16 years in CRO, 1,000+ A/B tests
Updated Oct 28, 2026 · 8 min read
The short answer
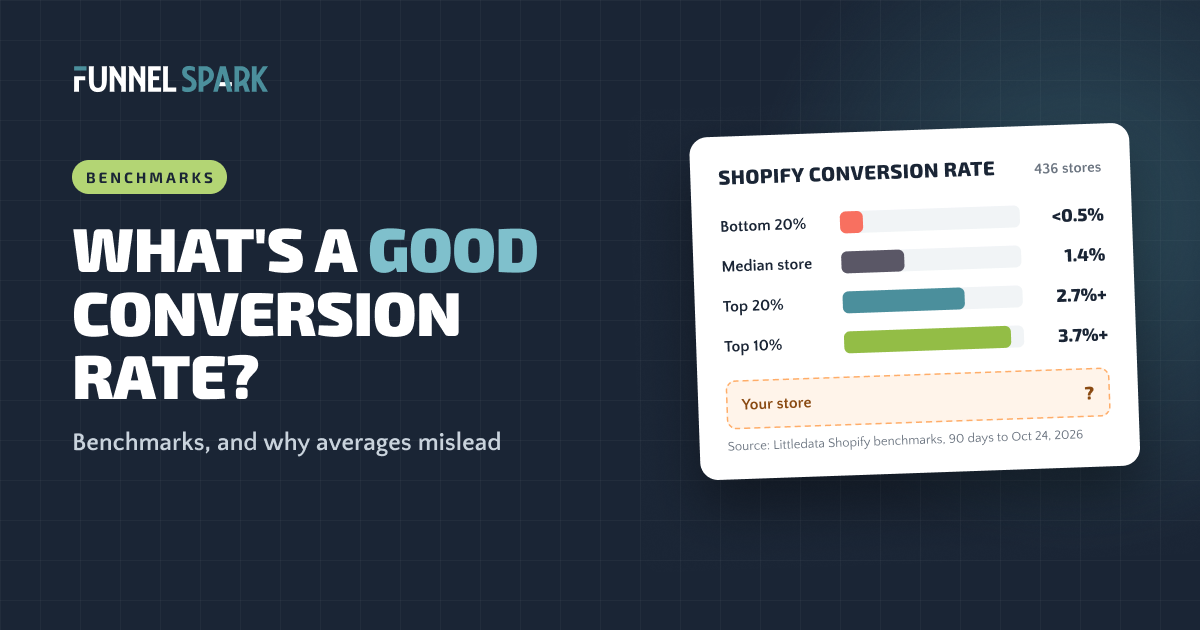
Most online stores turn 1% to 3% of visits into orders. On Shopify, the median store converts 1.4%. The top 20% convert 2.7% or more, and the top 10% convert 3.7% or more. But your industry, prices and traffic change what's normal. The best benchmark is your own number last month.
The average ecommerce conversion rate
Your conversion rate is the share of visits that end in an order. 2,000 orders from 100,000 sessions is a 2% conversion rate.
Ask 5 sources for the average and you'll get 5 answers. Here are the ones we trust most, because they share fresh data and say where it comes from:
- 1.4% median, 1.9% mean: 436 Shopify stores over the last 90 days, in Littledata's Shopify benchmarks.
- 1.97%: UK online stores in September 2026, in IRP Commerce's market data. A year earlier it was 1.68%.
- 2.66%: the global average across 400+ brands in Dynamic Yield's benchmark data, as quoted in Shopify's conversion rate guide. The same guide quotes Statista at 1.4% of global visits.
So the honest answer is a range: about 1.4% to 2.7%, depending on who's counting.
What's a good conversion rate on Shopify?
"Average" isn't the goal. Most store owners really want to know what good looks like. Littledata ranks its Shopify stores from worst to best, which gives us a much clearer picture than one average:
Shopify conversion rate, from bottom 20% to top 10%
Look at the jump from the median (1.4%) to the top 10% (3.7%). Same platform, and the best stores sell to more than 2.5 times as many of their visitors. That gap is mostly made of things you control: the offer, the product page, the cart and the checkout.
A simple way to use this: under 1%, fix the basics first. Between 1% and 2.7%, you're normal, and there's room to grow. Over 2.7%, you're in the top 20%, so small tested changes and order value will usually pay more than big redesigns.
Conversion rate by industry
What you sell changes everything. People buy a $25 face serum on a whim. They think hard before a $1,500 sofa. Here's how Shopify stores compare by industry:
Shopify conversion rate by industry
Products people buy again and again, like skincare, supplements and food, convert more than twice as well as fashion and furniture. A fashion store at 1.8% is beating most of its industry. A skincare store at 1.8% is behind.
Other sources see the same pattern, with different numbers. Here's the UK market by category:
UK conversion rate by category, September 2026
| Category | Conversion rate |
|---|---|
| Arts & Crafts | 5.76% |
| Health & Wellbeing | 2.83% |
| Kitchen & Home Appliances | 2.59% |
| Pet Care | 2.13% |
| Sports & Recreation | 1.90% |
| Cars & Motorcycling | 1.76% |
| Fashion, Clothing & Accessories | 1.62% |
| Food & Drink | 1.28% |
| Toys, Games & Collectables | 1.07% |
| Baby & Child | 0.44% |
Source: IRP Commerce. All UK categories together: 1.97%.
Dynamic Yield's data, quoted by Shopify, stretches even wider: from under 1% for luxury and jewelry to over 5% for pet care and beauty. Notice food converts at 2.3% in one source and 1.28% in another. That's not a typo. It's a hint about how much these numbers depend on who's in the sample.
Desktop vs mobile conversion rate
You've probably heard that mobile converts at about half the rate of desktop. Sometimes that's true. Sometimes it isn't:
| Source | Desktop | Mobile | Who's in it |
|---|---|---|---|
| Littledata | 1.4% | 1.5% | Median of about 430 Shopify stores, last 90 days |
| Contentsquare | 3.7% | About 2% | Retail sites in its 2026 Digital Experience Benchmarks |
In Contentsquare's retail data, desktop wins by a mile. In Littledata's Shopify data, the median store converts about the same on both. Different stores, and one is a median while the other is an average.
What matters more: about 67% of Shopify traffic is now mobile, says Littledata. So check your own split. If your mobile rate is far below your desktop rate, your mobile store is where the money is leaking. Start with the product page on a phone. Our product page optimization guide shows what to fix first.
Why averages mislead
Benchmarks are useful for a gut check. They're dangerous as a target. Here's why:
- Price changes everything. A $300 product will convert lower than a $30 one, and that's fine. If you sell high-ticket items, a 1% rate with a big order value can make more money than a 3% rate with a small one.
- Traffic quality changes everything. Email subscribers and returning customers convert far better than cold visitors from a TikTok ad. Run a big ad push and your conversion rate drops, even if your store got better.
- New vs returning visitors. A store with lots of loyal customers will always look better than a new brand buying all its traffic.
- Averages get pulled up by a few stars. Littledata's mean is 1.9%, but its median is 1.4%. A small group of stores converting very well drags the average up. Most stores sit below "average."
- Not everyone counts the same way. Some tools divide orders by sessions. Others divide by users, which gives a higher number because one person can visit 3 times. Two "2%" stores might not be the same at all.
"An average tells you where other stores are," says Nicolas Fradet, founder of FunnelSpark. "Your own numbers tell you where your money is leaking."
How to find your real conversion rate in Shopify
Shopify does the math for you. Here's how to get a number you can trust:
- Open Analytics in your Shopify admin and find the conversion rate report.
- Pick at least the last 30 days, so one big sale or one slow week doesn't fool you.
- Look past the headline number. Shopify shows how many sessions added to cart, reached checkout and completed checkout. That's your funnel.
- Break it down by device and by traffic source. Your mobile rate from paid social and your desktop rate from email are two different stores.
Shopify counts sessions, not people. GA4's numbers won't match exactly, and that's normal. Pick one source and stick with it.
5 benchmarks that matter more than conversion rate
Conversion rate is one number at the end of a long path. These tell you where on that path you're losing people. All figures are medians from Littledata's Shopify benchmarks.
| Metric | Median store | Top 20% | What it tells you |
|---|---|---|---|
| Revenue per session | $1.93 | $4.22+ | What each visit is worth. The best single number. |
| Add-to-cart rate | 6.8% | 12%+ | If your product pages make people want to buy |
| Checkout completion | 51% | 67%+ | If your checkout lets people finish |
| Bounce rate | 40% | Under 20% | If your landing pages match what people clicked on |
| Cart abandonment | 70% average (Baymard) | How many carts never become orders | |
The cart abandonment figure is the average of 50 studies collected by Baymard Institute. Littledata counts a bounce as a short visit with one page and no action.
Start with revenue per session. It's conversion rate × order value, so it catches changes that get more orders but smaller ones. We explain it in our guide to revenue per visitor. Then look at each step. If your add-to-cart rate is fine but checkout completion is low, don't touch your product pages. Fix checkout.
The top 20% of Shopify stores make $4.22 or more per visit, vs $1.93 for the median store. Same traffic, more than double the money. Source: Littledata.
How to beat the benchmark
Forget chasing an industry number. Aim to beat your own number from last month. Here's where we'd start:
- Low add-to-cart rate? Work on the product page: photos, price, reviews, shipping info and the Add to Cart button. See our product page guide.
- Lots of abandoned carts? Show shipping costs early and remove surprises. Our cart abandonment guide covers the top reasons.
- Low checkout completion? Add express pay buttons, guest checkout and fewer fields. See our Shopify checkout optimization guide.
- Good conversion, low order value? Try a free shipping threshold set just above your average order.
- Lots of traffic, few sales? Find your biggest leak first with our guide for stores with traffic but no sales.
Then test your changes instead of just switching them on. We've run 1,000+ A/B tests, and 37% of them won, against an industry average of about 15%. Even good ideas lose often, so testing is how you keep the wins and drop the losers.
Not sure where your store stands? Our free Leak Finder scores your store on 20 checks, from homepage to checkout. For the full list, use our 40-point ecommerce CRO checklist.
FAQ
For most online stores, 1% to 3% is normal. On Shopify, the median store converts 1.4%, the top 20% convert 2.7% or more, and the top 10% convert 3.7% or more (Littledata). What's good for you depends on your industry, prices and traffic, so compare against your own past numbers too.
In Littledata's benchmark of 436 Shopify stores, the median conversion rate is 1.4% and the mean is 1.9%. The mean is higher because a small group of stores converts very well and pulls the average up.
On Shopify, yes. 2% beats the median store (1.4%) but is below the top 20% (2.7%). In beauty, supplements or food, where the median is closer to 2.3% to 2.5%, 2% is a bit behind. In fashion or furniture, where the median is about 1%, it's strong.
Phones make it harder to compare products, read details and fill in forms. Many people also browse on mobile and buy later on a laptop. But some Shopify stores convert just as well on mobile, so a big gap is a sign your mobile product pages or checkout need work.
In Littledata's Shopify data, the median bounce rate is 40%. Under 20% puts a store in the best 20%, and over 56% puts it in the worst 20%. A high bounce rate usually means the page doesn't match what the visitor clicked on.
Written by
Nicolas Fradet
Nicolas is the founder of FunnelSpark, an ecommerce CRO agency. He has spent 16 years finding out why shoppers don't buy, with 1,000+ A/B tests run and a 37% win rate. He wrote Stop Guessing. Start Converting.
Follow Nicolas on LinkedIn →Want us to find what's stopping your shoppers?
On a free 30-minute call, Nicolas looks at your store and shows you 3 growth opportunities, whether we work together or not.
Book your free call